

479,590
Formal Employees
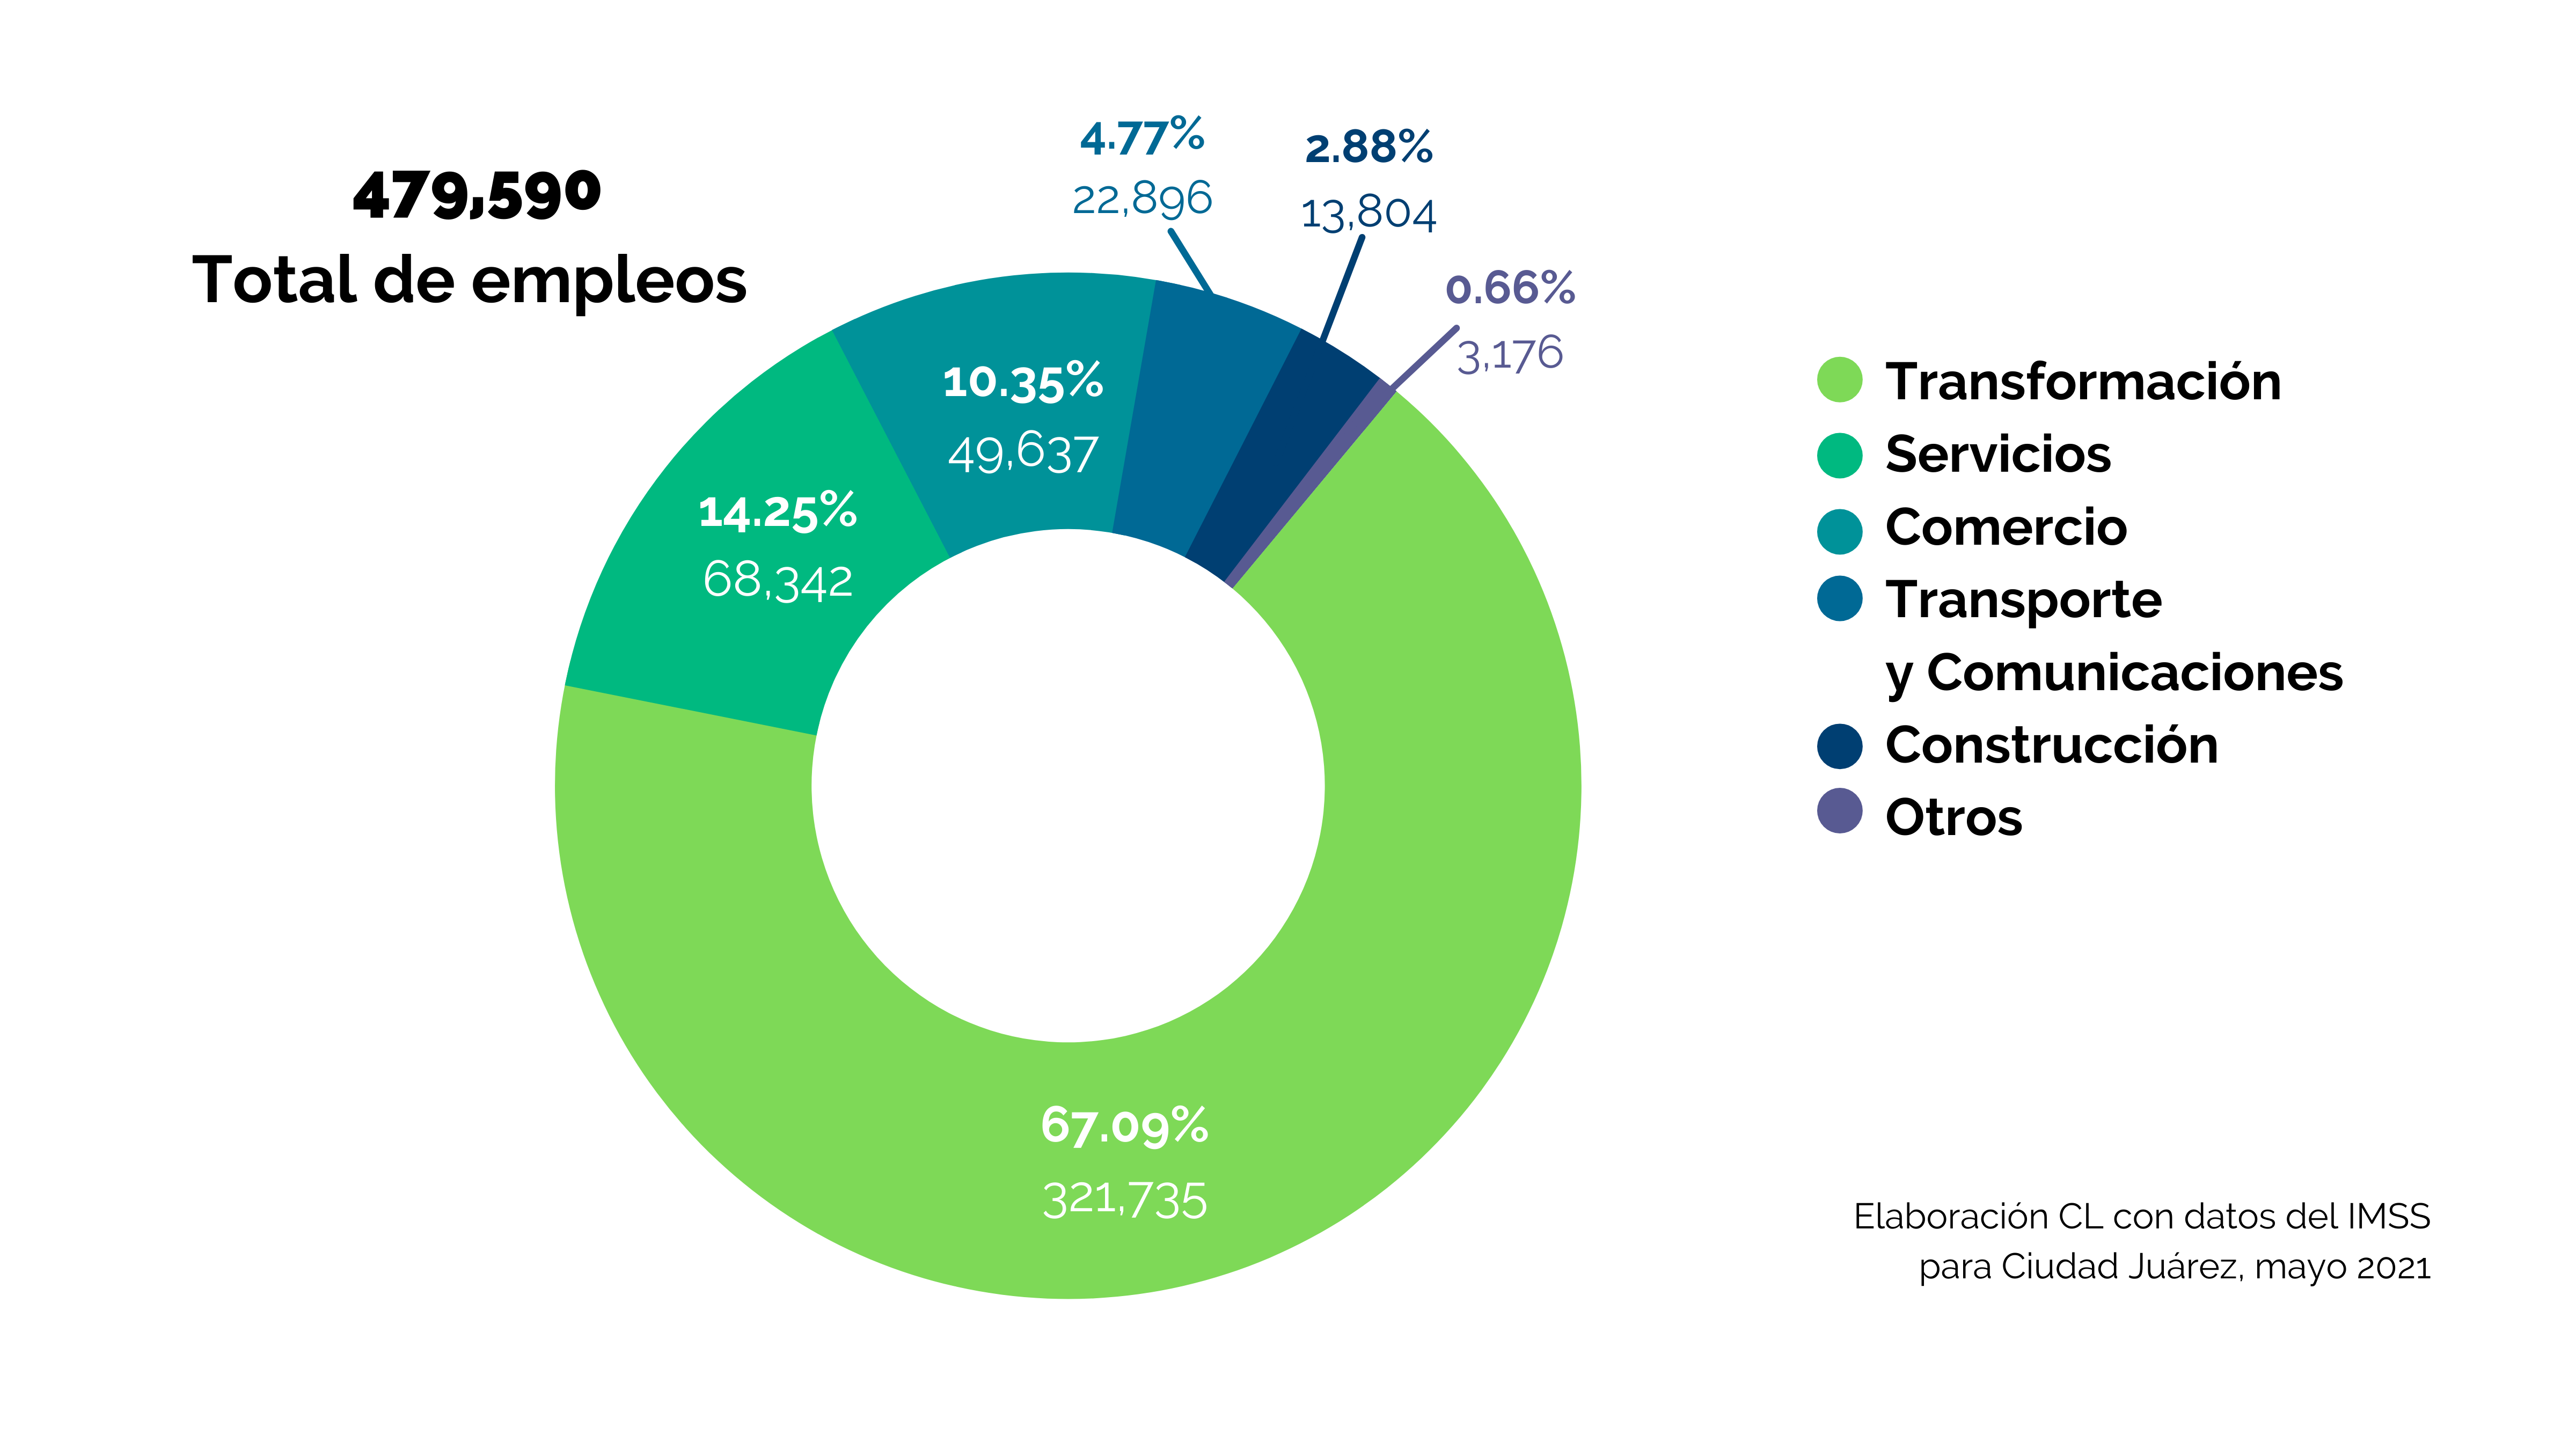
Employment structure
Participation
Percentage of people who are working or looking for work among the population aged 15 years and over.
Unemployment
ENOE reports an unemployment rate in Juárez 1.34% lower than the national average.
Informality
Juárez continues to maintain one of the lowest rates of labor informality in Mexico.
Employees
Of the 691,826 employed inhabitants, 77% reported working as paid employees (537,500).
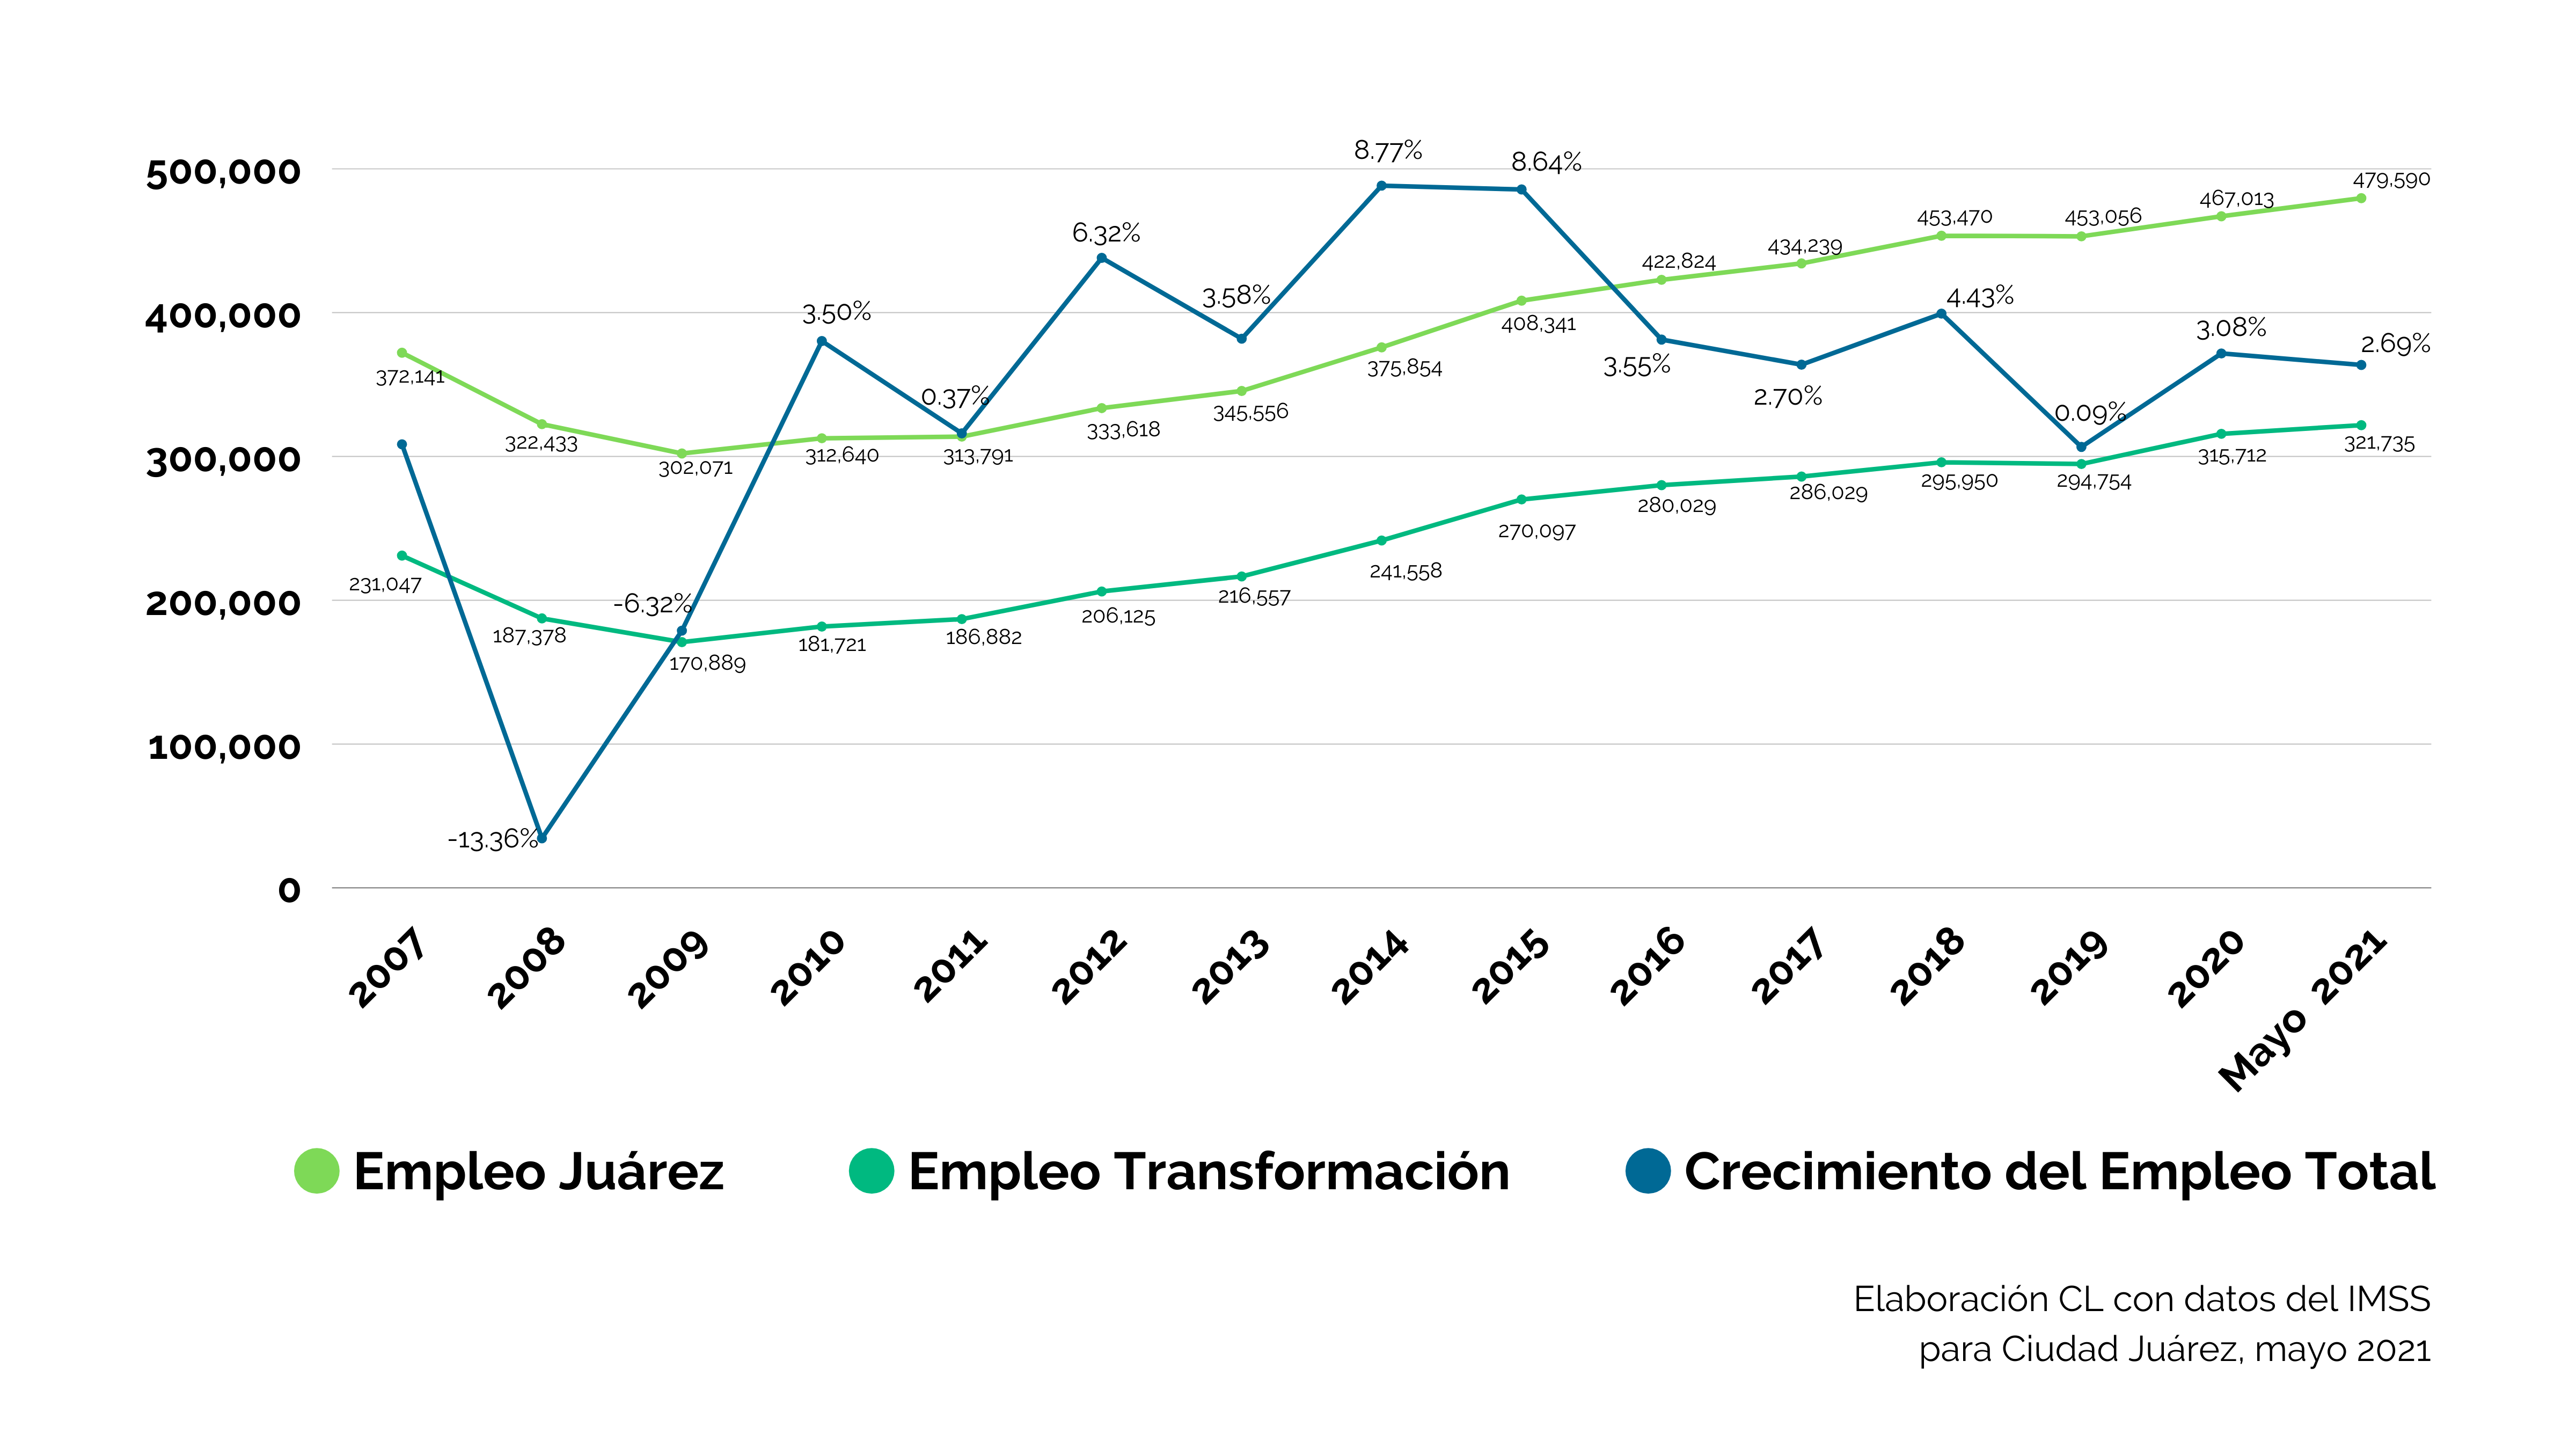
Employment by Sector
Average salary
From 2015 onwards we have seen how the average daily salary reported by the IMSS for Juárez has taken off significantly, this year is 13.8% above the national average.

Employees by salary range
From $ 4,251 to $ 8,501 monthly (1 – 2 s.m.) 39%
From $ 8,502 to $ 12,752 monthly (2 – 3 s.m.) 31%
From $ 12,753 to $ 17,003 monthly (3 – 4 s.m.) 10%
From $ 17,004 to $ 21,255 monthly (4 – 5 s.m.) 19%
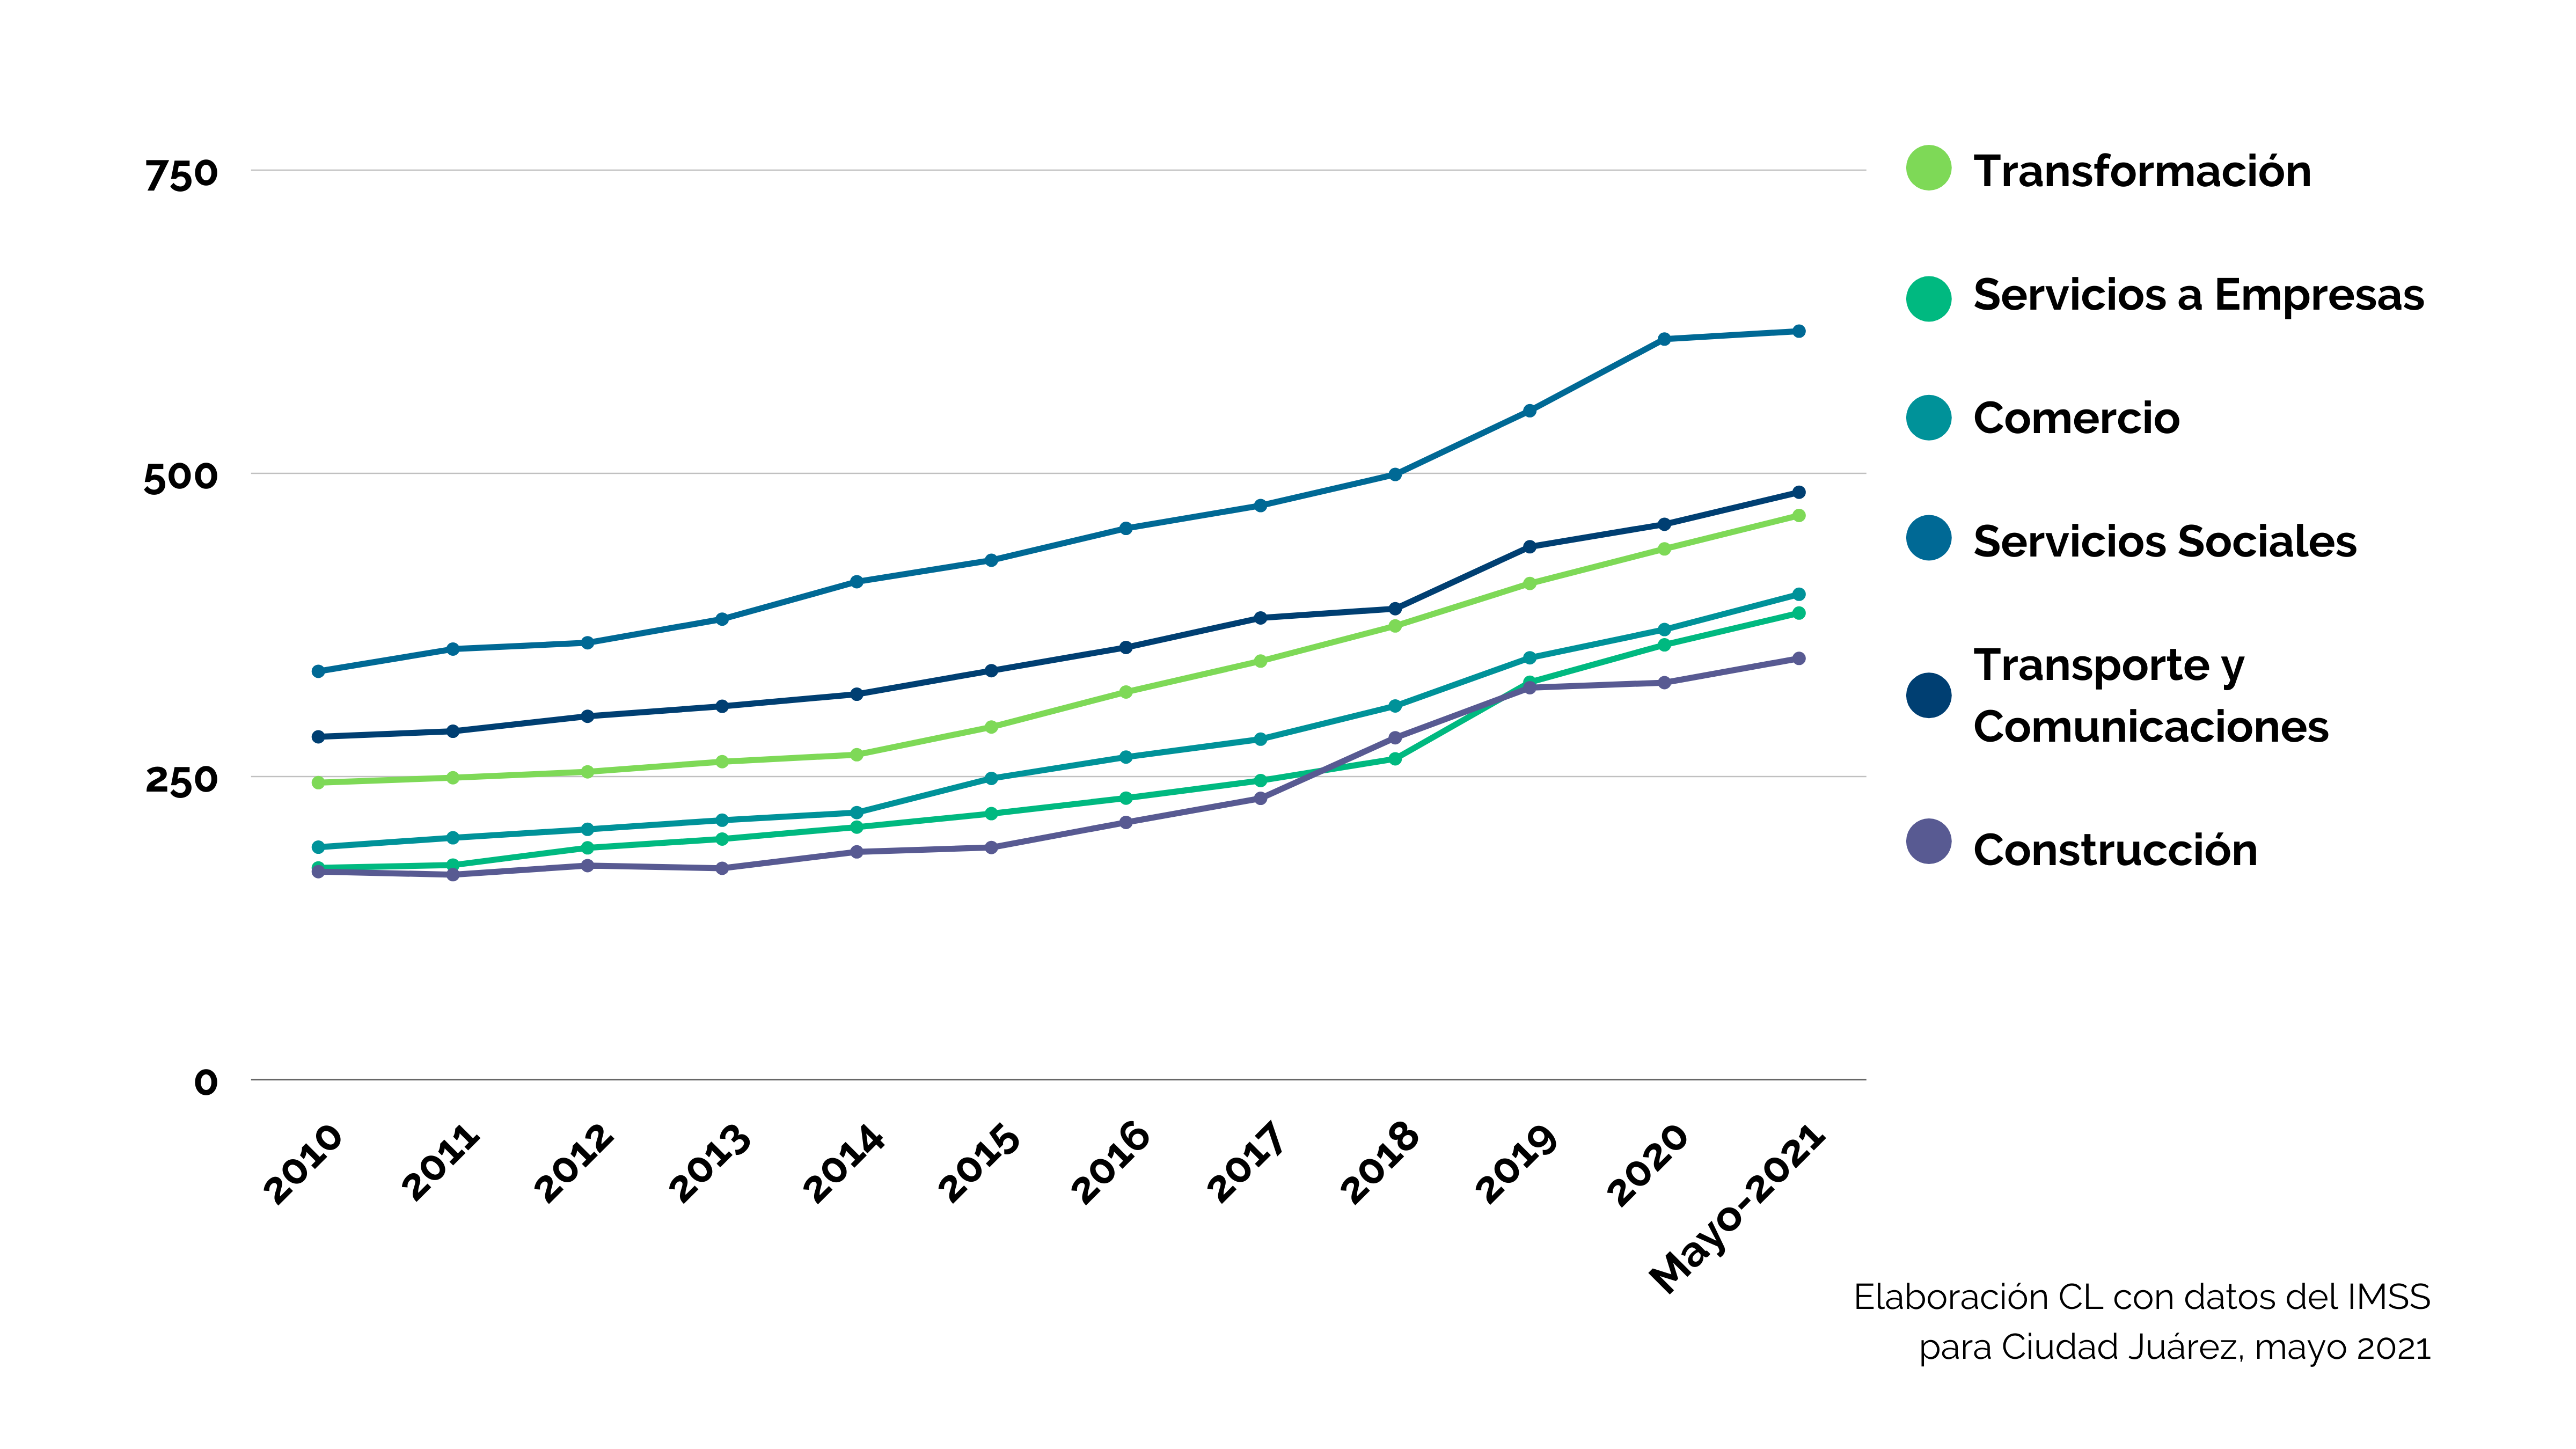
Salary by Sector
This data has remained in the same order year after year, with the social sector continually reporting the highest average salaries, as well as the construction sector the lowest.
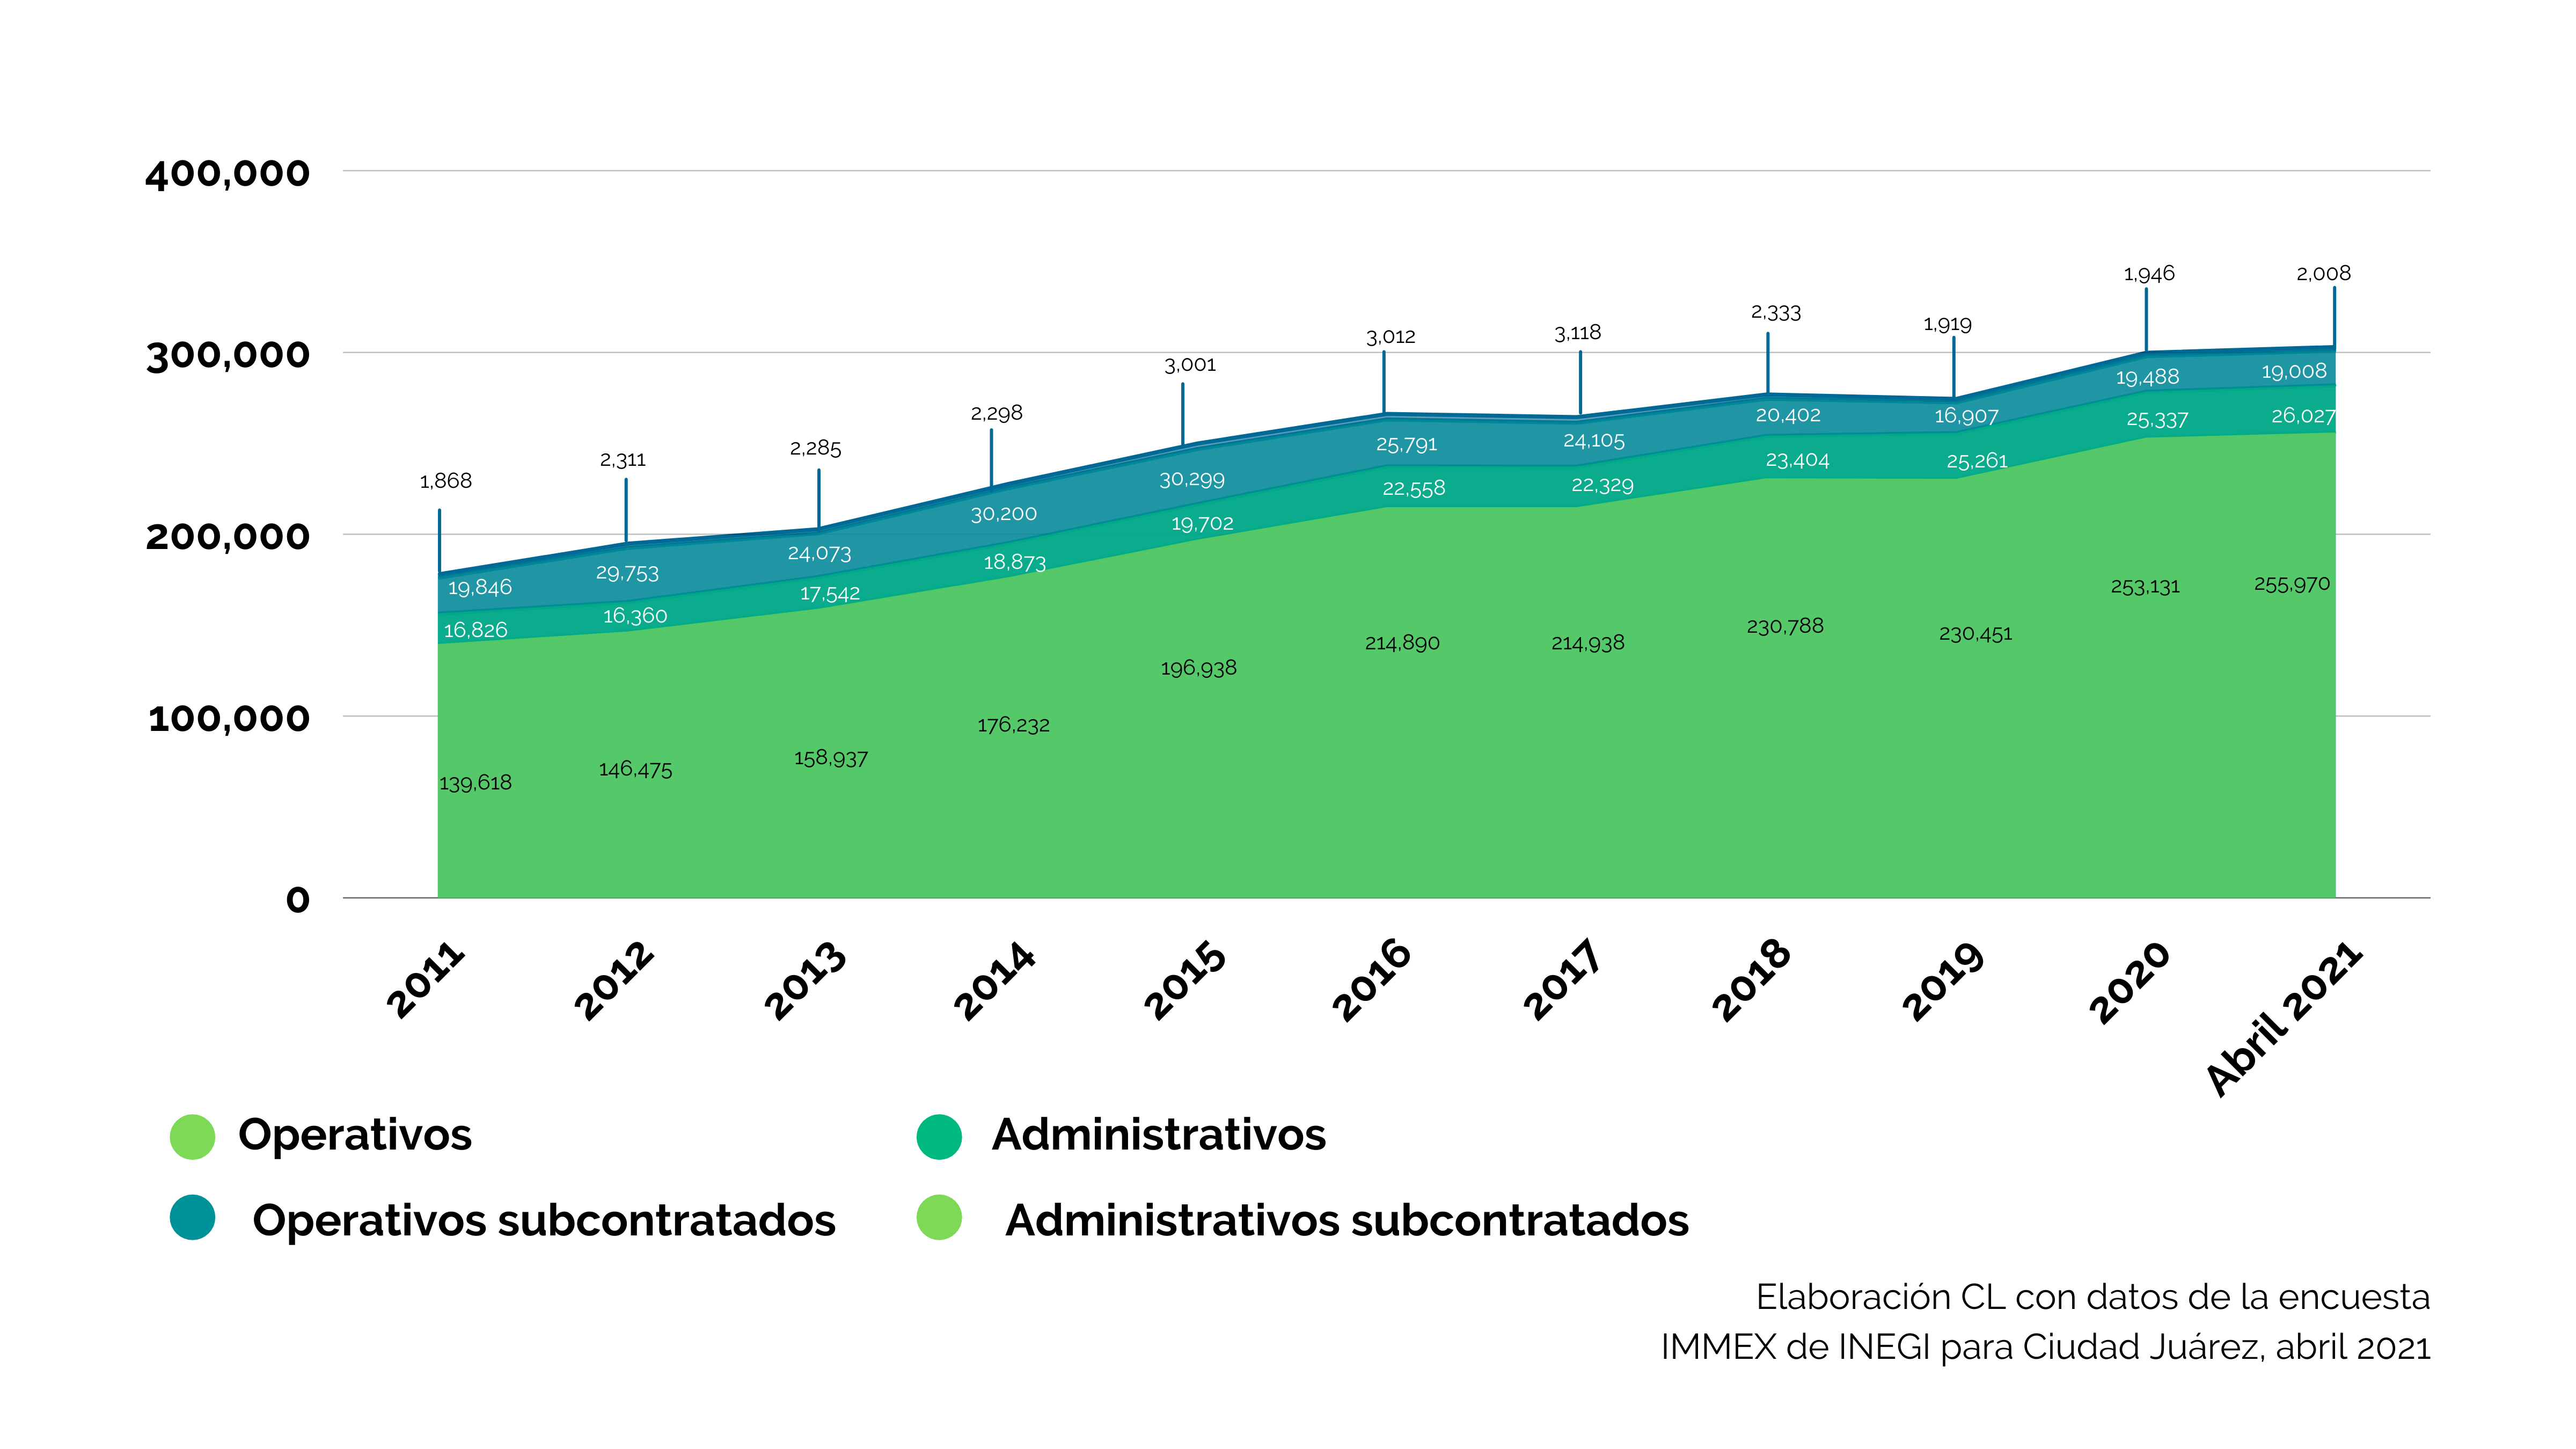
Employment at IMMEX
IMMEX employment represents 56% of the paid employment reported by ENOE and 63% of the employment reported by IMSS, with Juárez being the city in Mexico with the highest number of employees in the manufacturing sector.

Unemployment
Juárez has maintained its rate of unemployment at 3.01% during 2021, a level well above the 1.8% that closed pre Covid. However, Juarez has a 9.5% underemployment rate, meaning that 4,797 people are looking for different job.
Salary by Gender

Structure of Employment
The National Survey of Occupation and Employment shows us how employment is structured in Juárez based on people answers. Therefore, this data differs from the official company registry called Social Security.
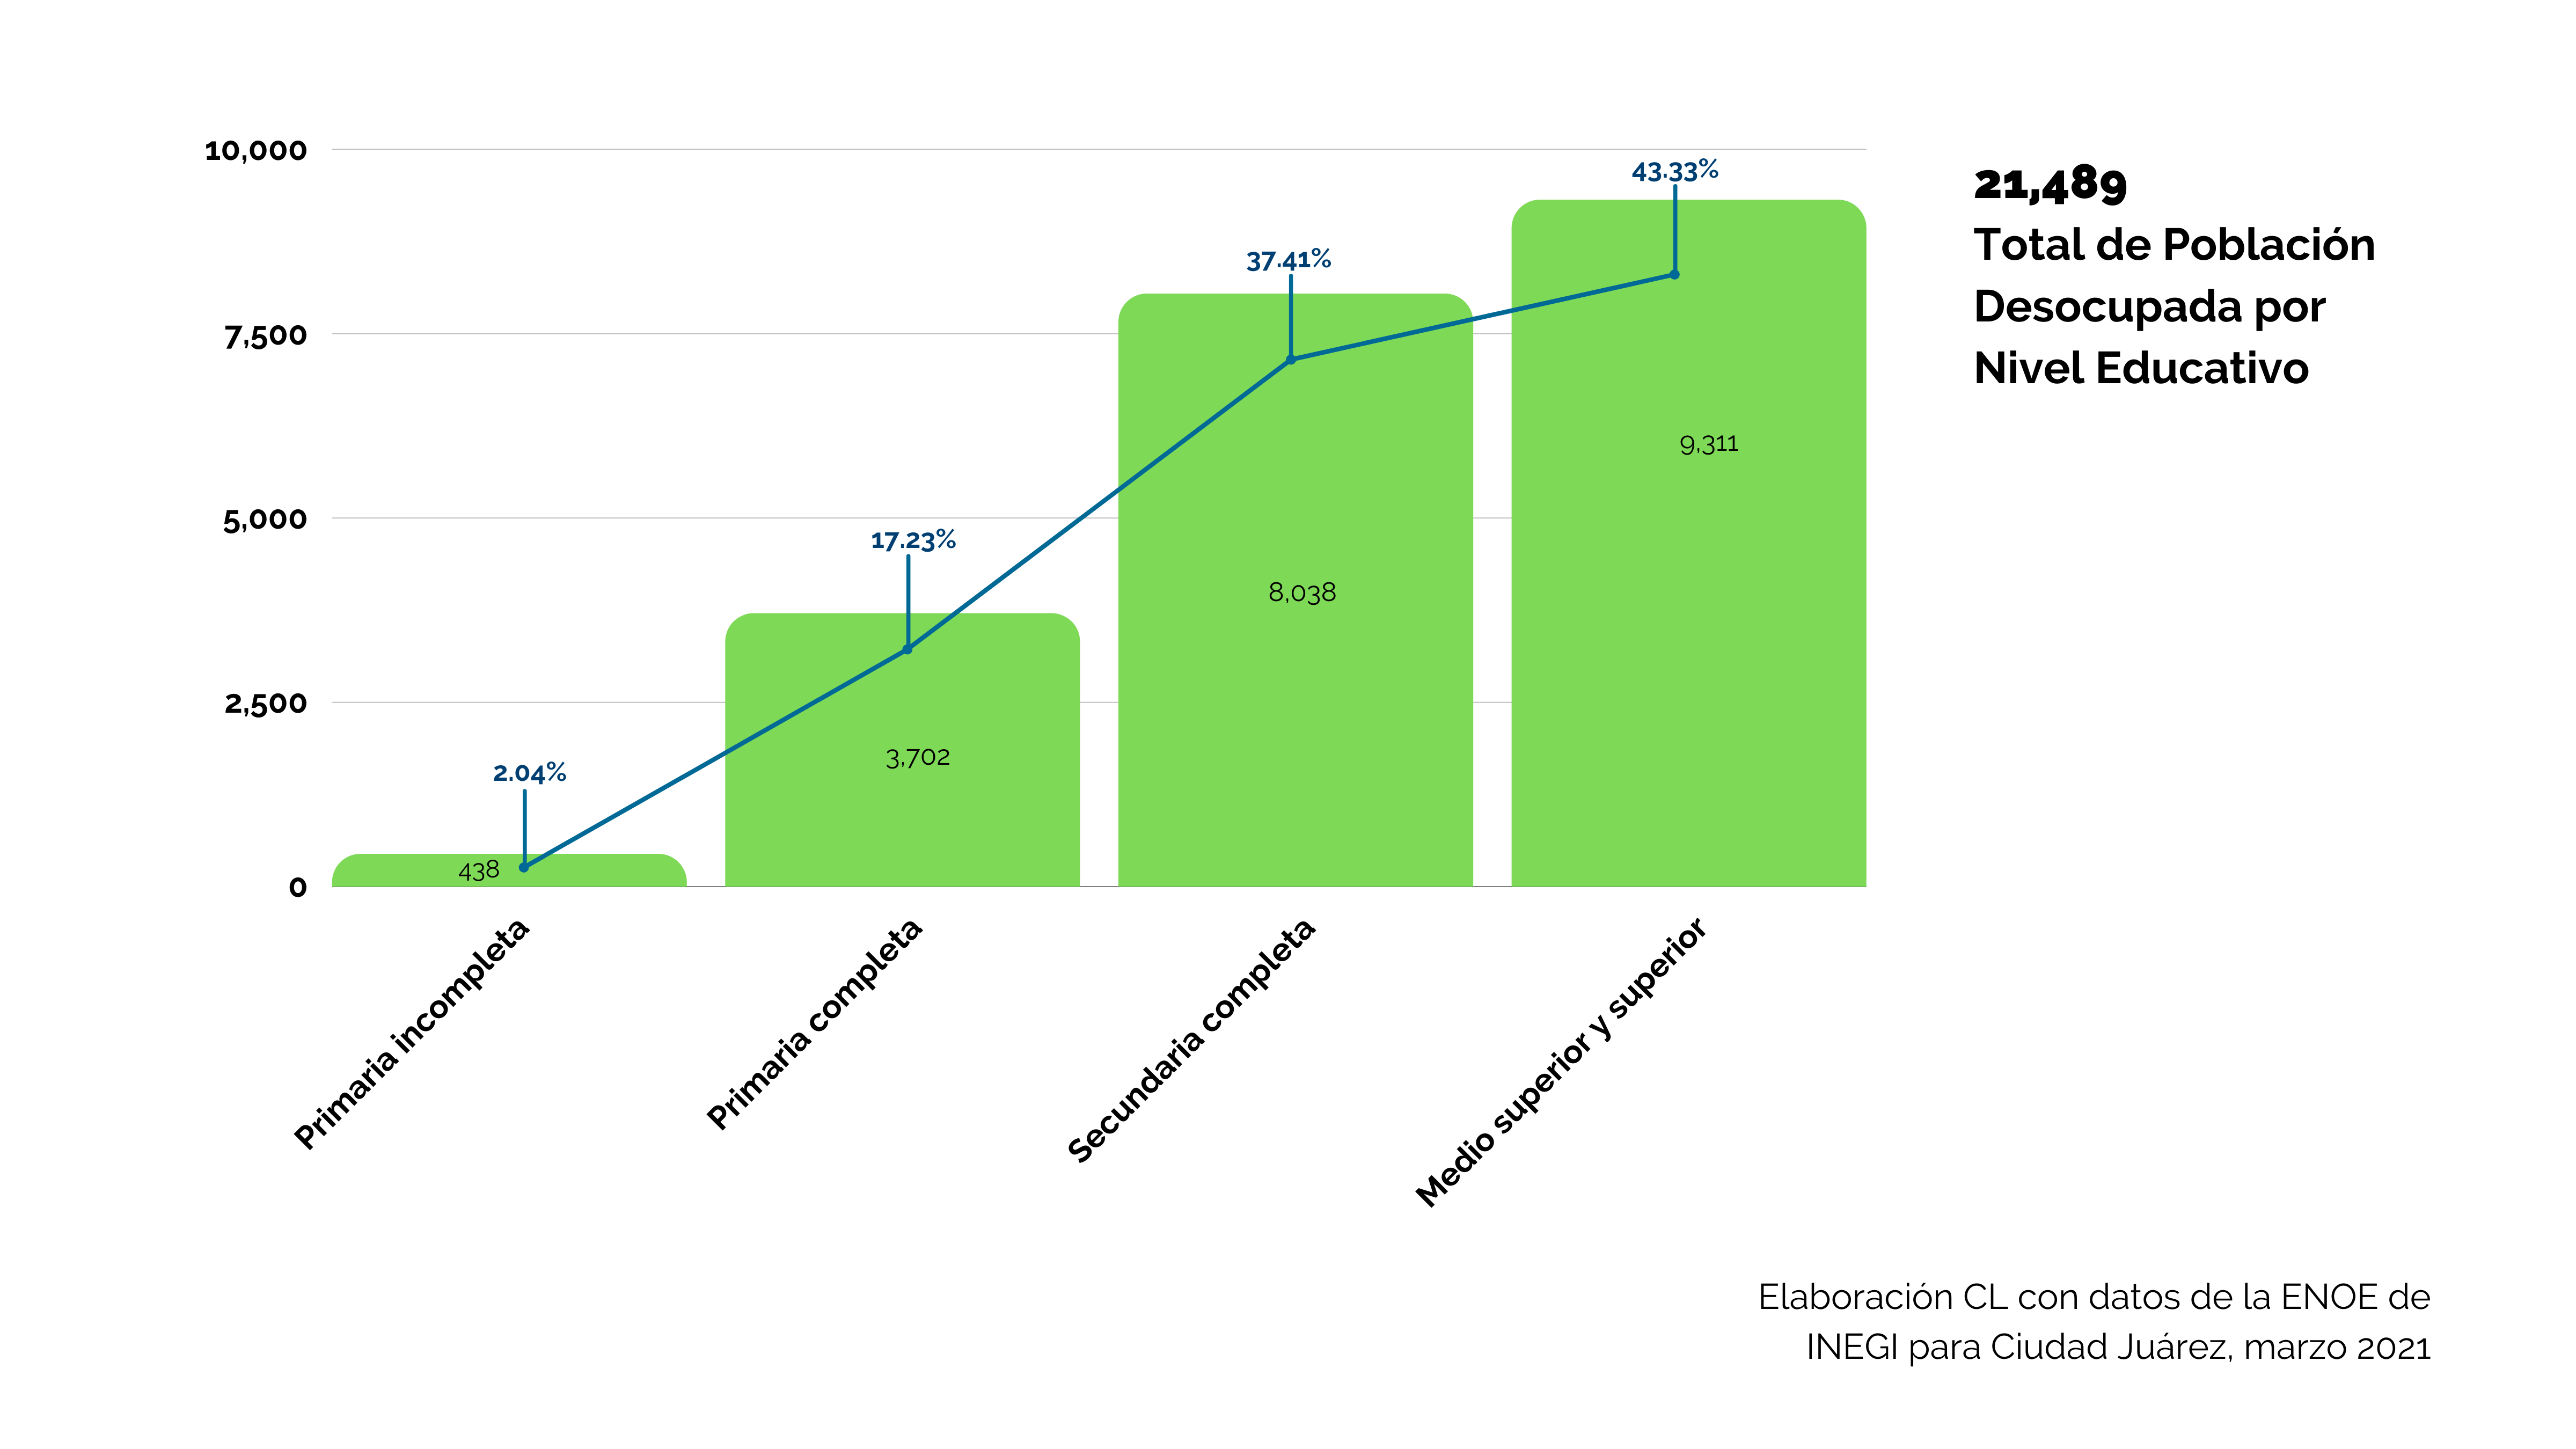
Unemployment by Education
Most of unemployed people in Juárez have a high school degree or higher education, meaning more specialized jobs are needed.
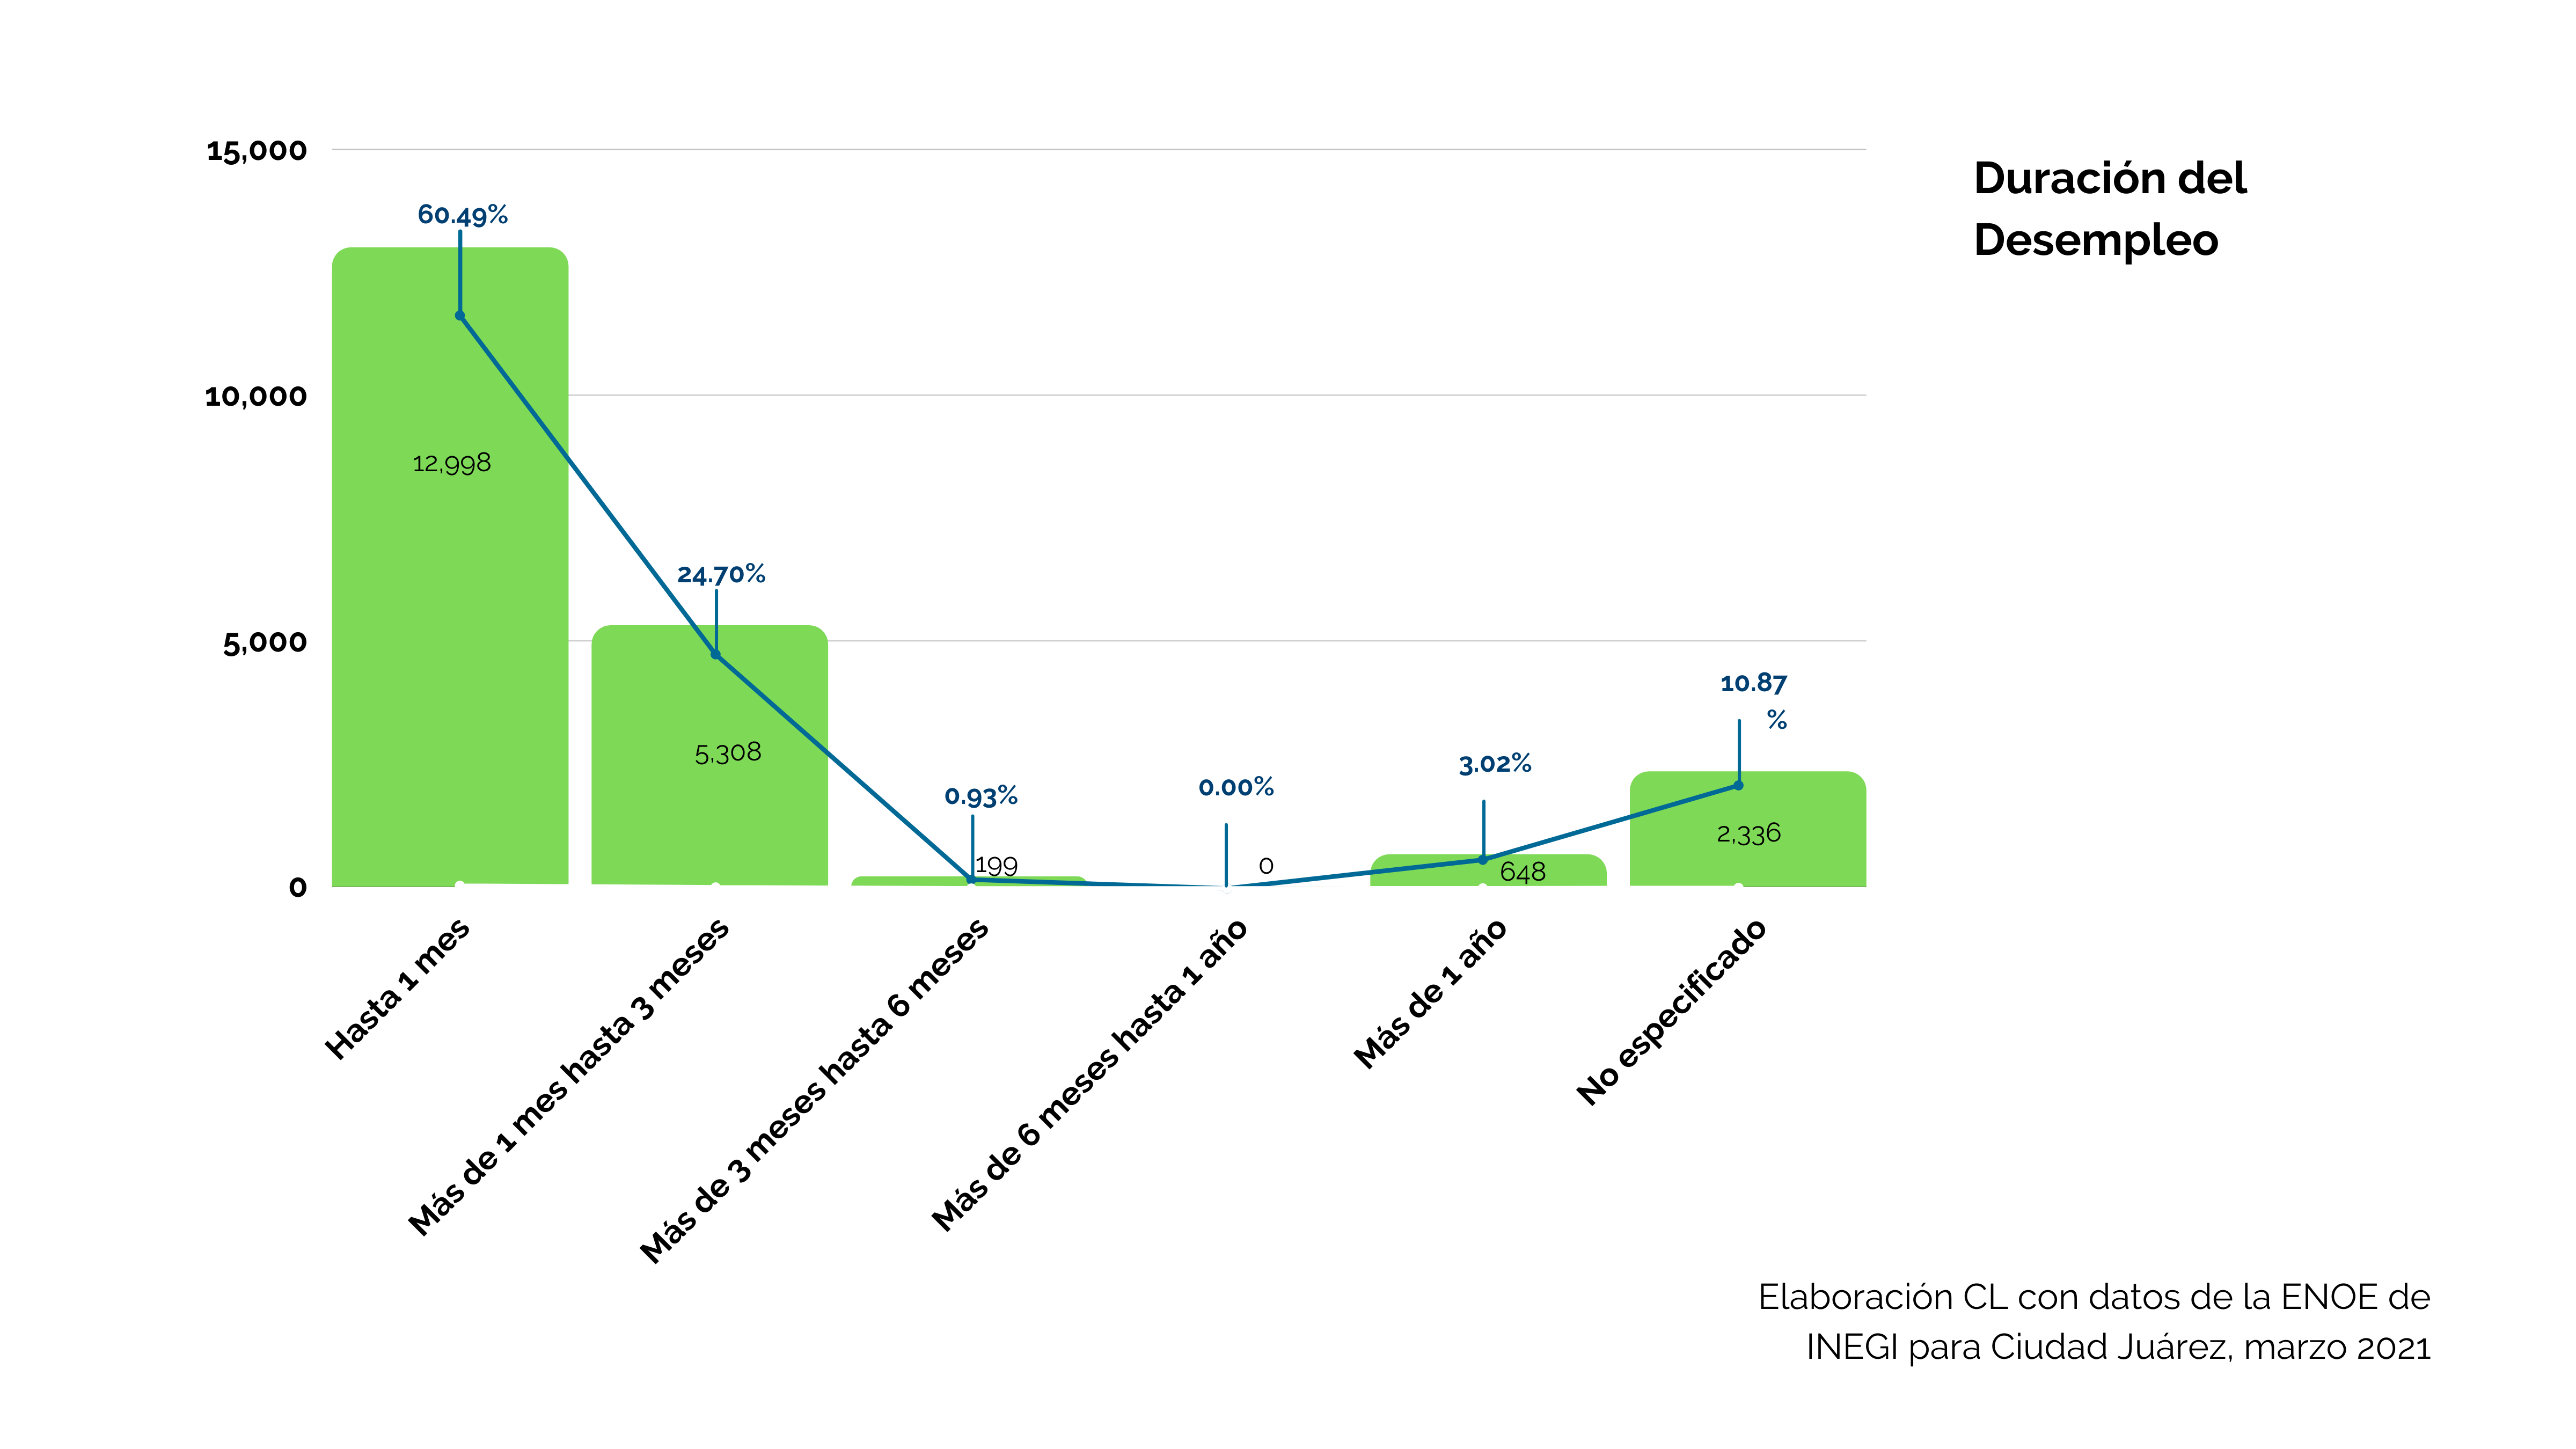
Duration of Unemployment
Most of unemployed people find work relatively quickly in Juárez, the major of them lasting about one month to find a suitable job.

Working hours
According to the OECD, Mexico has led for several years the international lists of countries with the most hours worked by employees per year, followed by South Korea, Greece, India, Russia, Costa Rica and Chile.
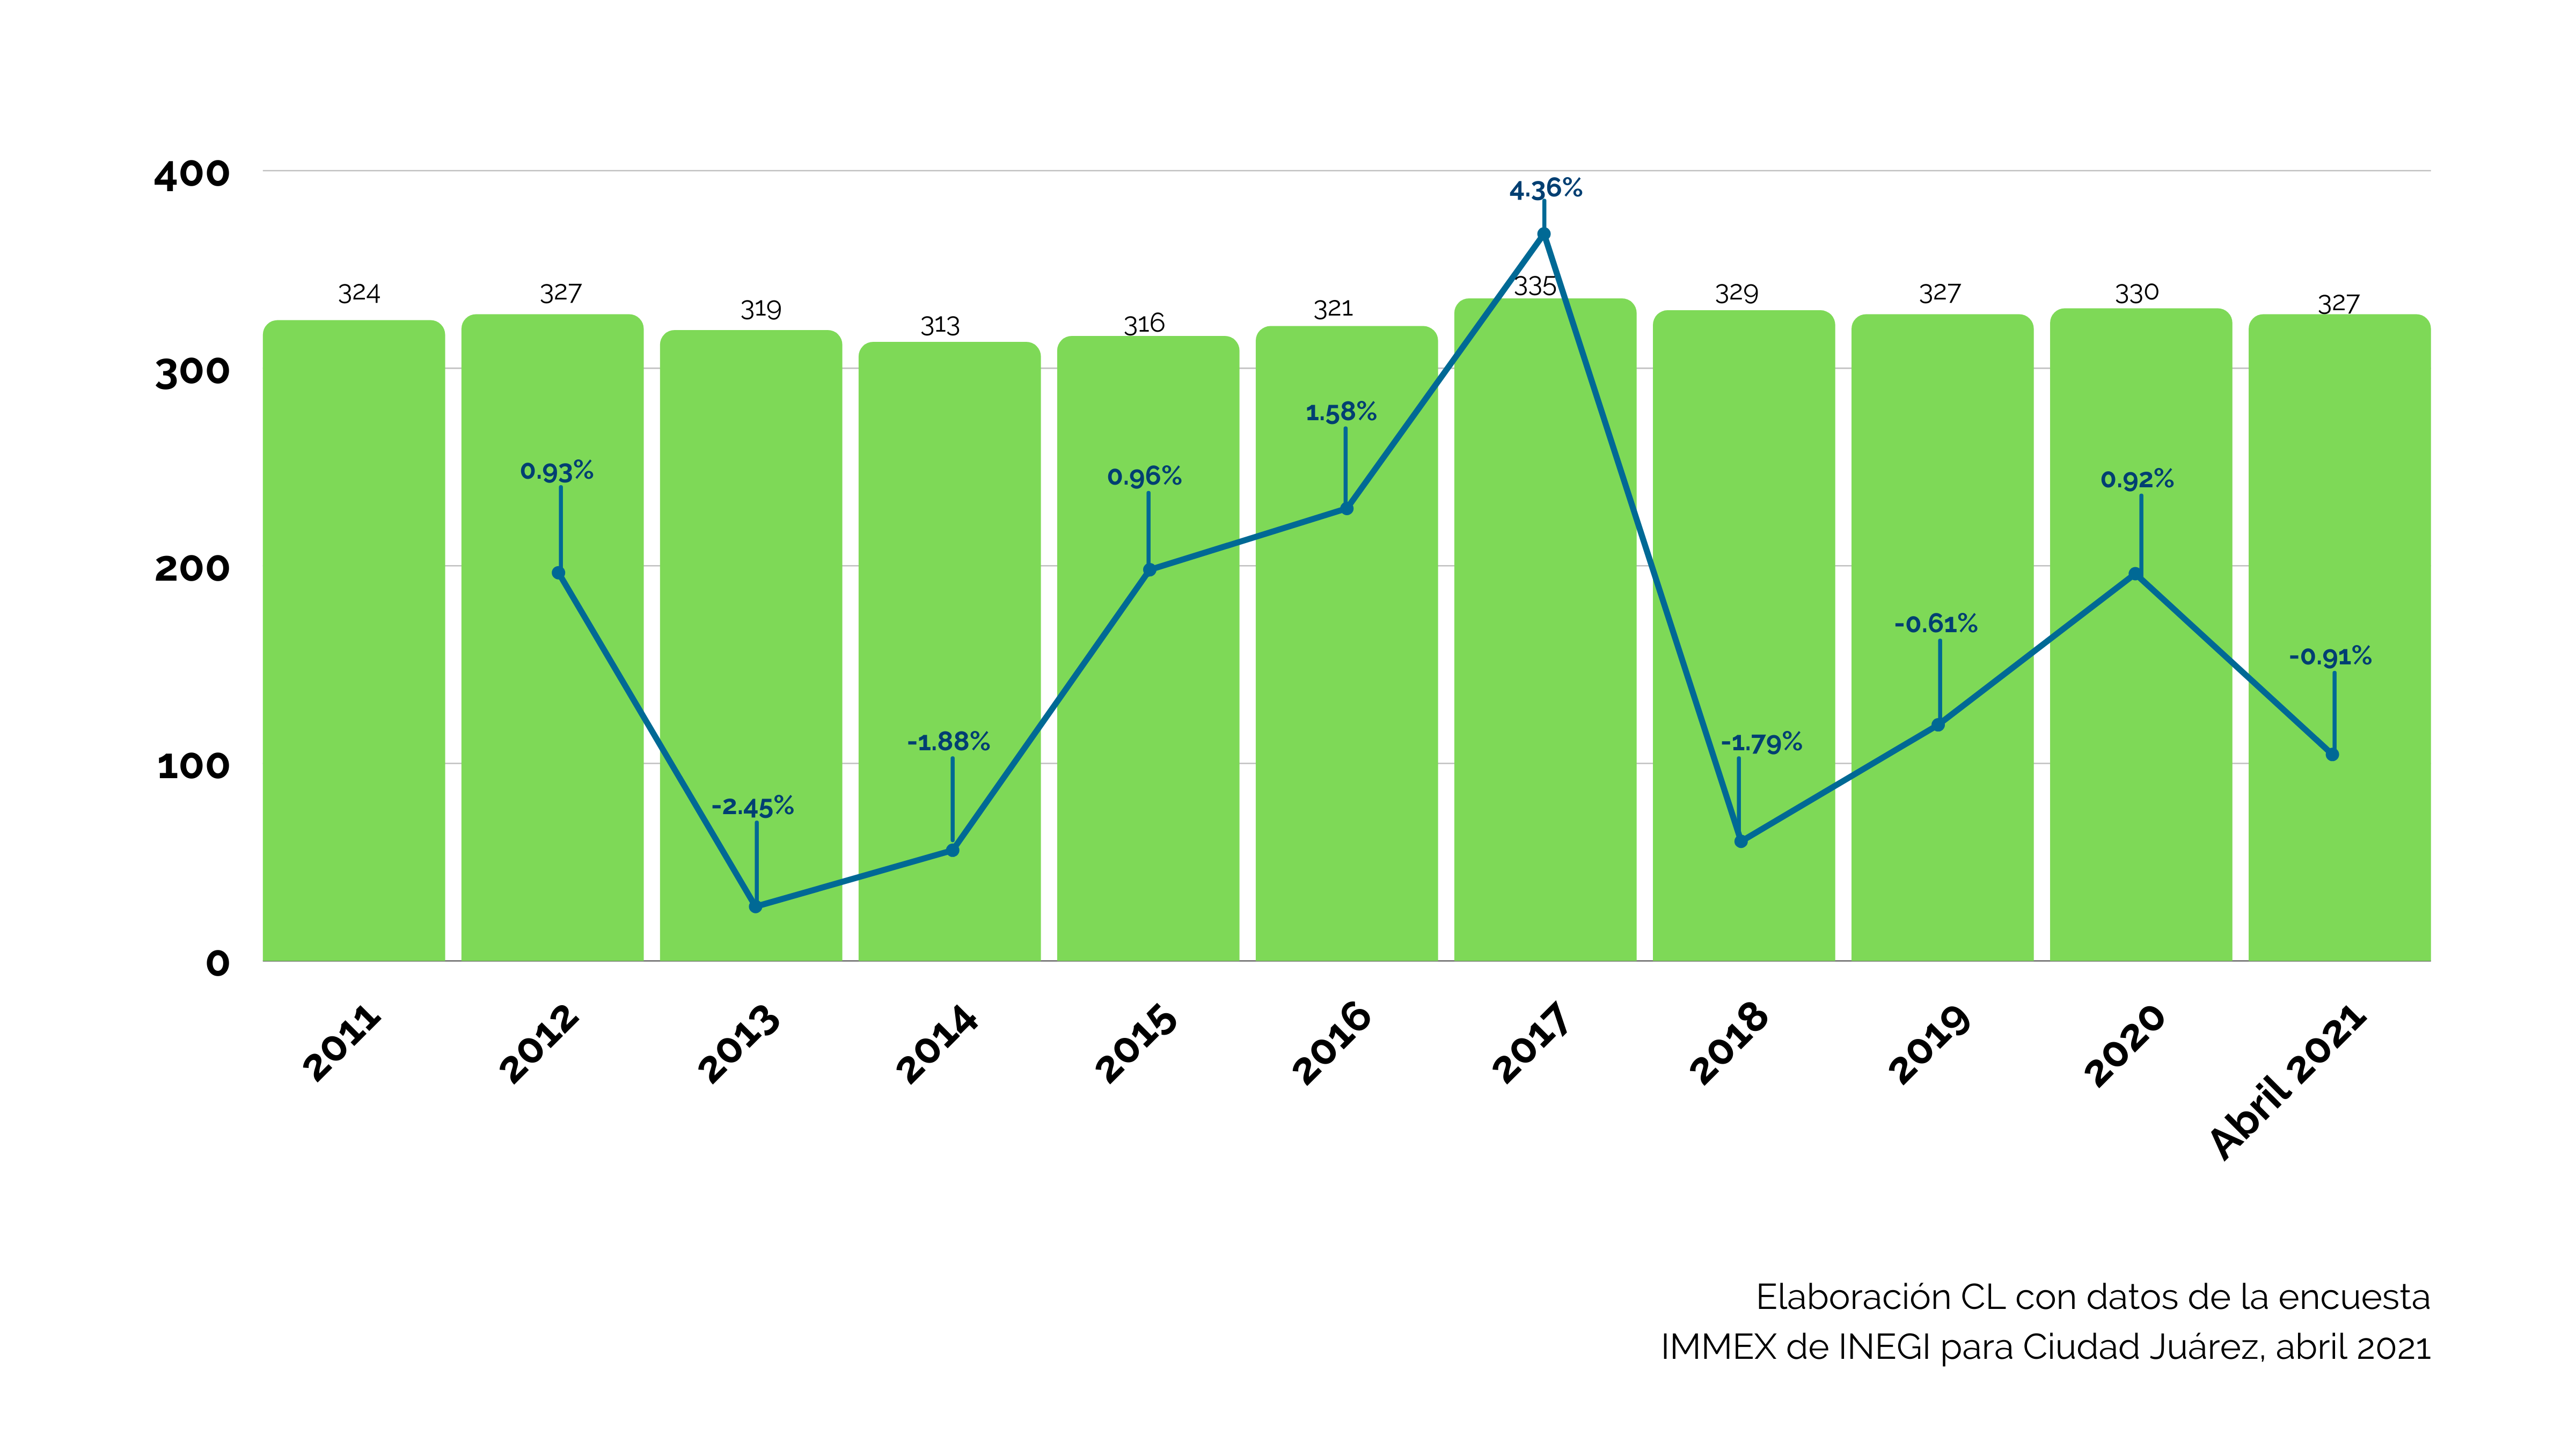
IMMEX companies
The number of manufacturing and export companies has been steady over the last 10 years. We have seen growth more significantly from companies that already have operations in the city.
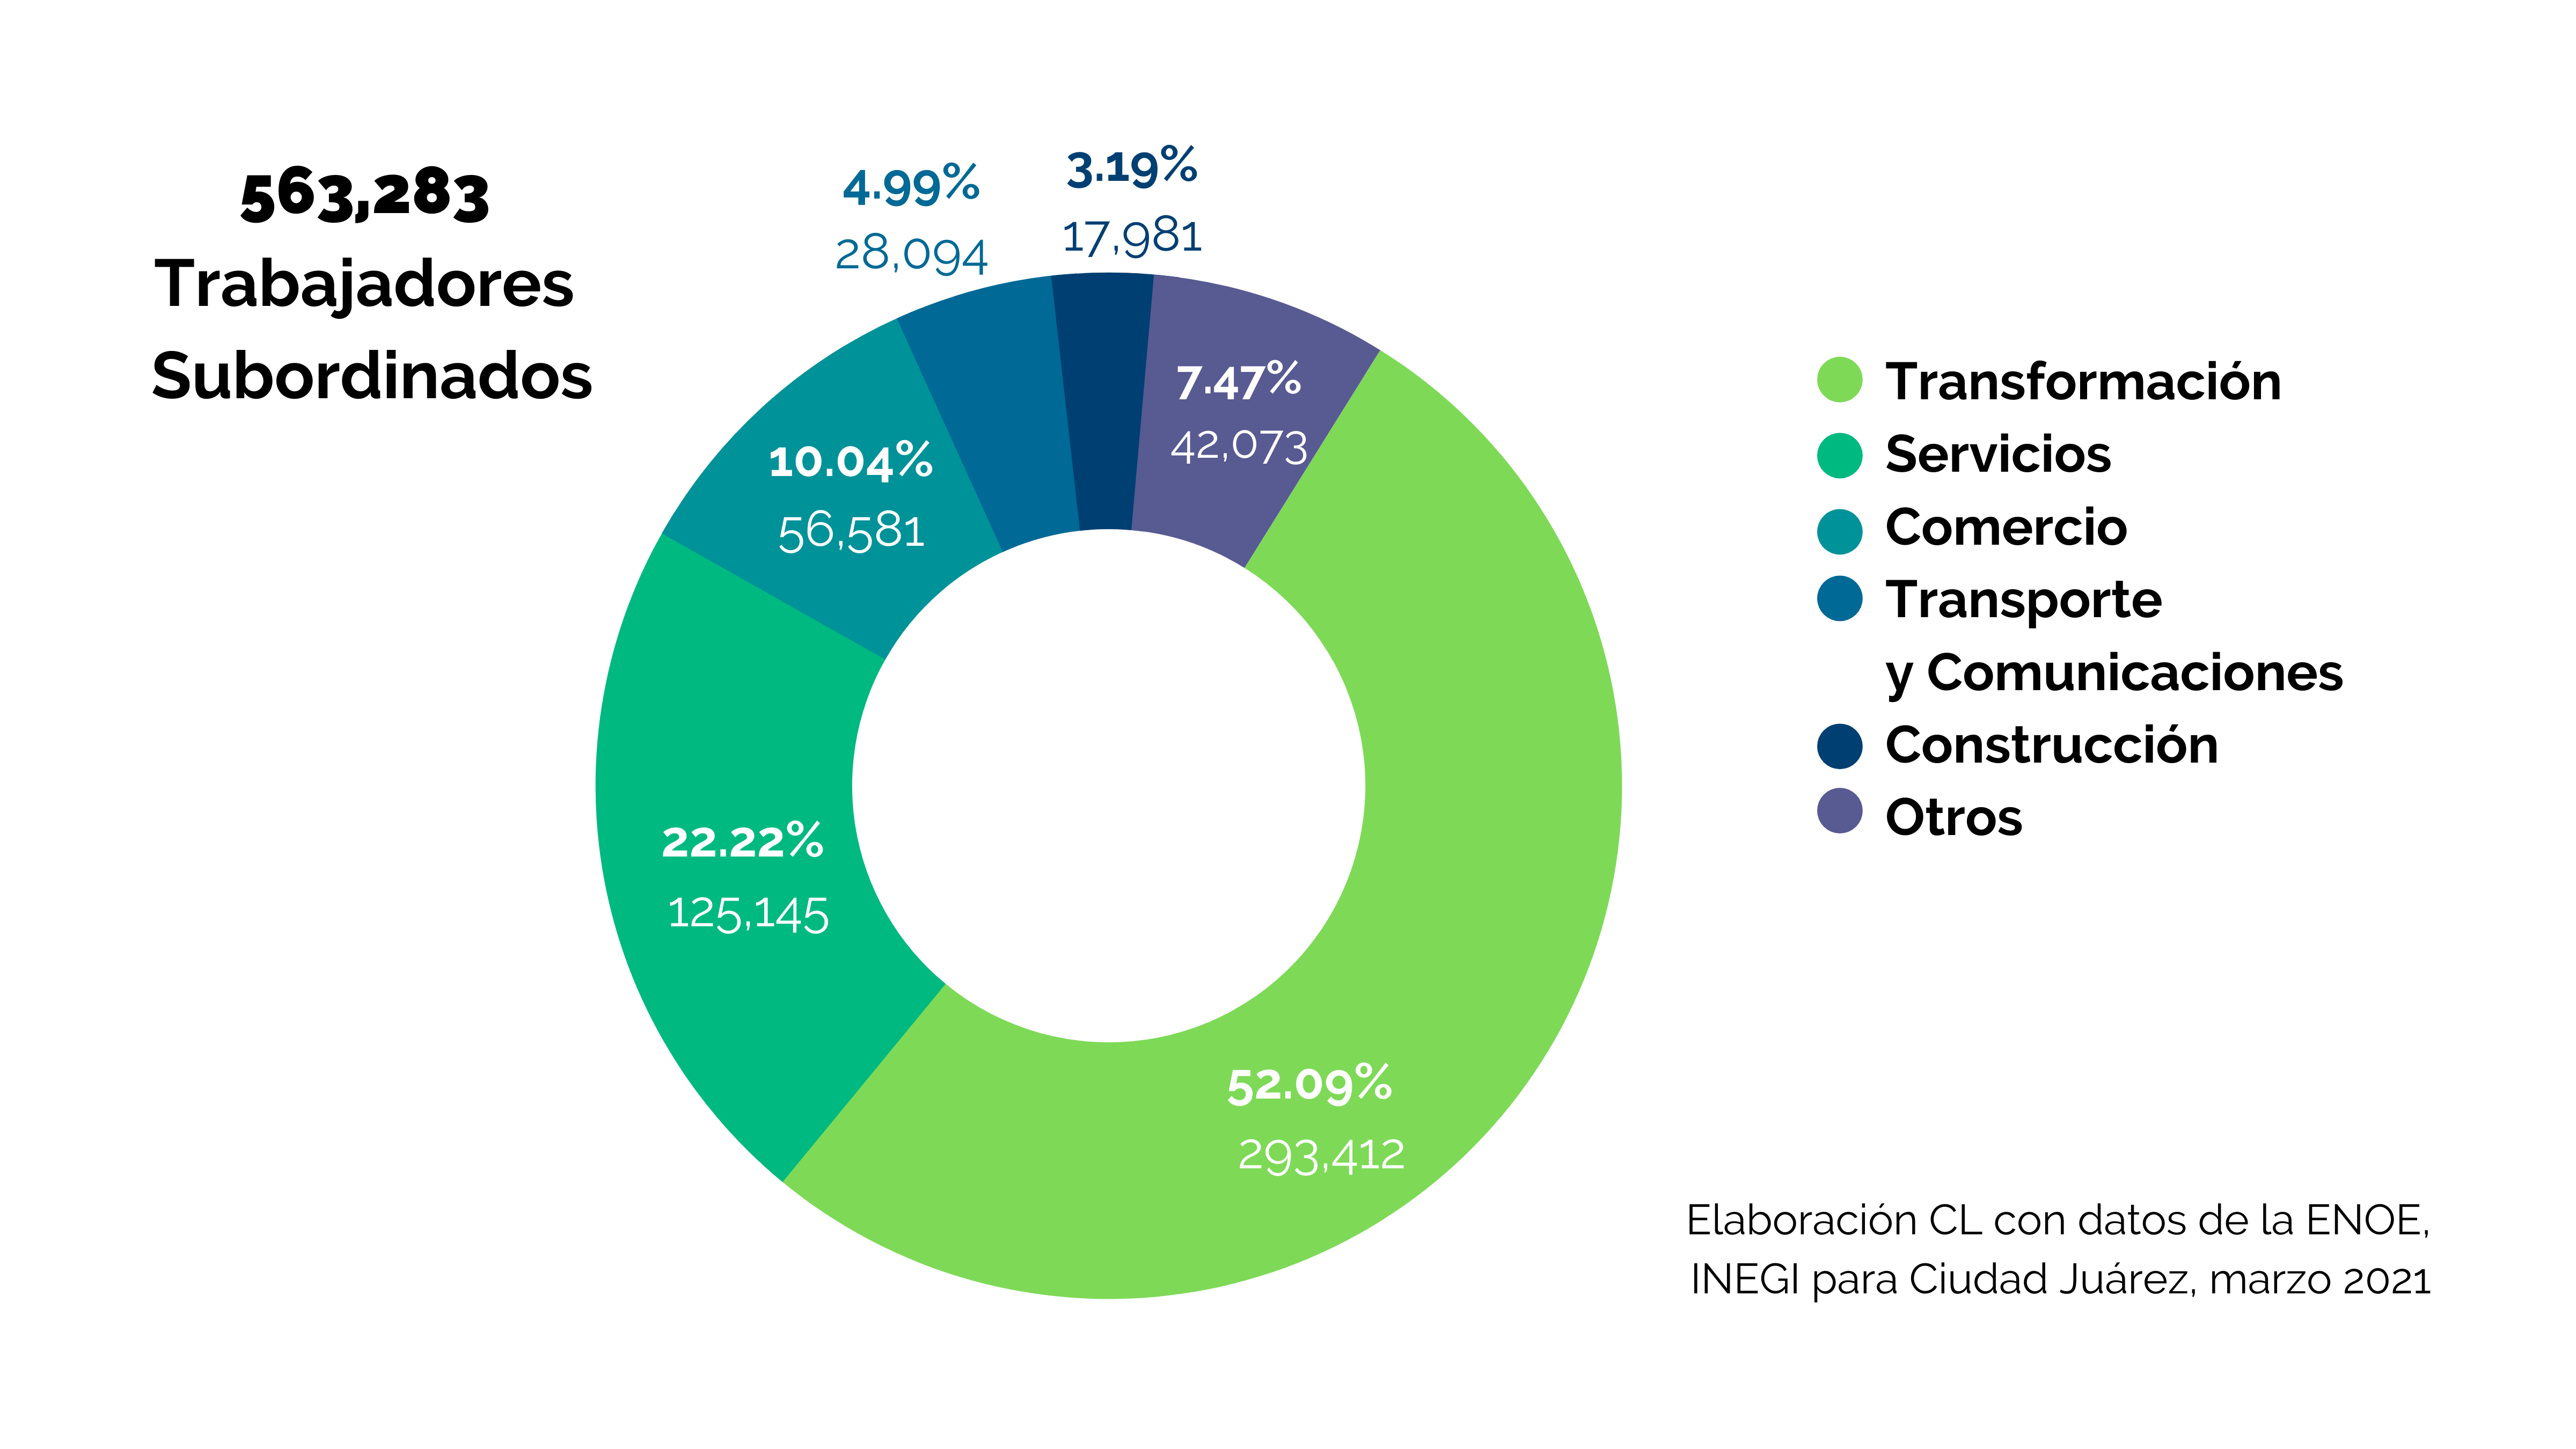
Employment by ENOE Sector
The Occupation and Employment survey reports data somewhat different from that of the IMSS, because it is based on the response of those surveyed, while the IMSS is based on employers’ registries.
Data source
Data updated to March and May 2021
OLA, Ministry of Labor and Social Welfare with data from the IMSS and ENOE, INEGI.
Labor Competitiveness with data from the IMSS, IMMEX and ENOE, INEGI.
Unemployment rate for years prior to 2019 in Ciudad Juárez calculated by Economic Development of Ciudad Juárez A.C. with data from the IMSS and ENOE, INEGI.
https://worldpopulationreview.com/country-rankings/average-work-week-by-country
L1 = 1 at 3.9 s.m .; L2 = 4 to 6.9 s.m .; L3 = 7 to 9.9 s.m .; L4 = 10 to 13.9 s.m .; L5 = 14 – 25 s.m.
s.m .: Minimum salary